This page focuses on the usability test reporting output of Ovo Studios Ovo Logger ADC 2.0 ("Ovo Logger") software. For details about Ovo Logger, please go to the Ovo Logger page.
Usability Reporting in Ovo Logger: Synopsis
Usability test reporting exposes your study's data to your stakeholders and Ovo Logger has the following kinds of data:
- Video recordings — up to four video inputs as separate MP4 files.
- Textual data logging — free-form text entry and picking from custom lists of QuickLog "markers."
- Findings — textual descriptions of high-level results with supporting logged observations.
- Video highlights.
- Post-test logging functionality is identical to real-time logging.
After your study, logged data and video can be exported to HTML and CSV format within seconds, allowing you to give your stakeholders access to your test data with minimal effort.
The remainder of this page reviews the main data views of the Ovo Logger usability report. Click here to jump to the online version of this report.
Usability Reporting in Ovo Logger: Screen Shots
Ovo Logger's report is in HTML format and uses only client-side code, so it can be viewed from anywhere, i.e., you do not need to host it on a webserver. You could run it from a USB memory stick.
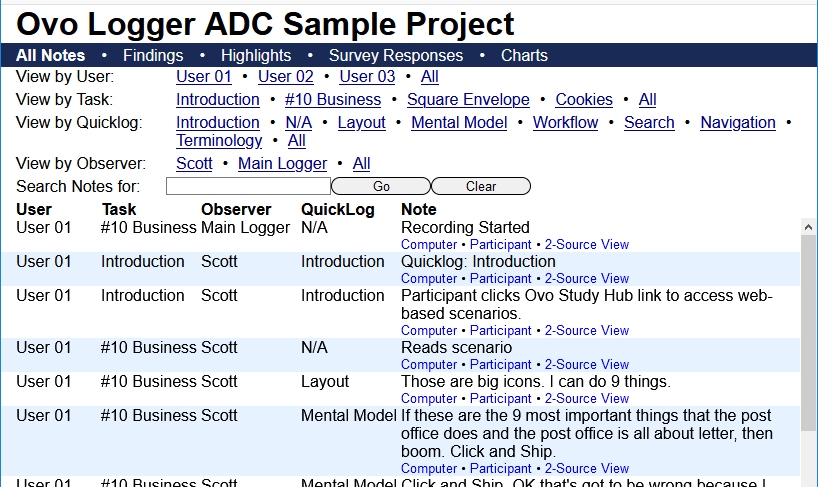
Logged Observations with Filtering: The following screen shot shows the top portion of the Ovo Logger report home page. There are five filters you can use to search for observations of interest (Participant ID, Task ID, QuickLog marker, Observer name, and string.)
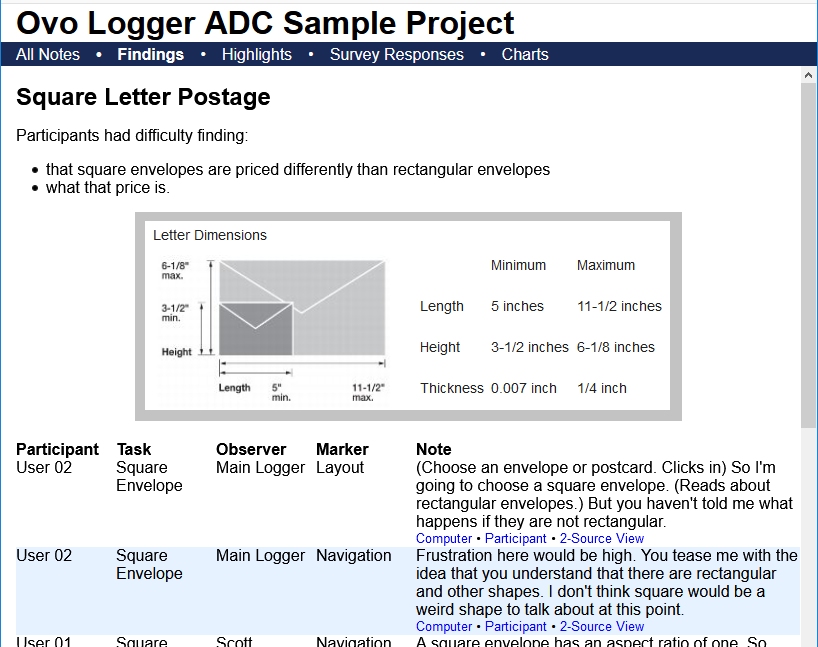
Findings: If you would like, you can create findings in the Ovo Logger software and this section will be included in your report. Findings can have logged observations associated with them for quick reference to participant reactions.
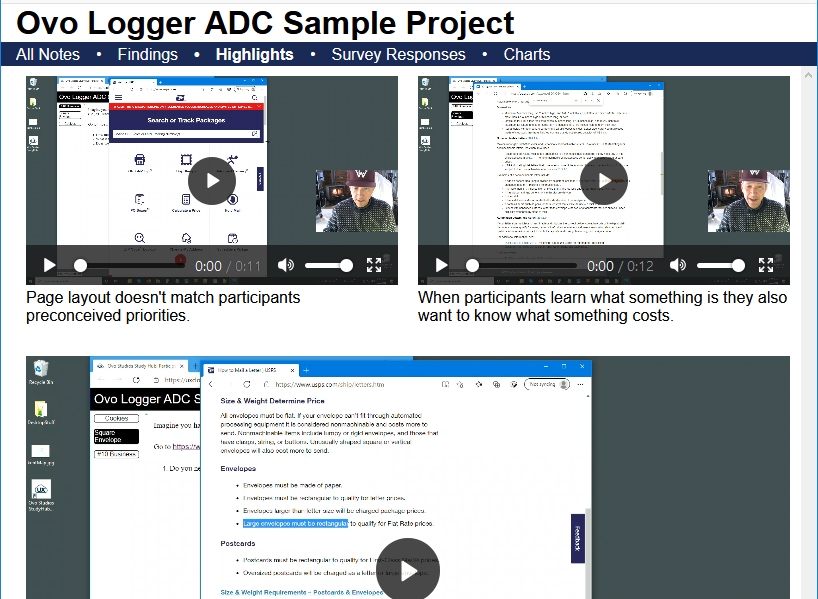
Highlights: If you would like, you can create findings in the Ovo Logger software and this section will be included in your report.
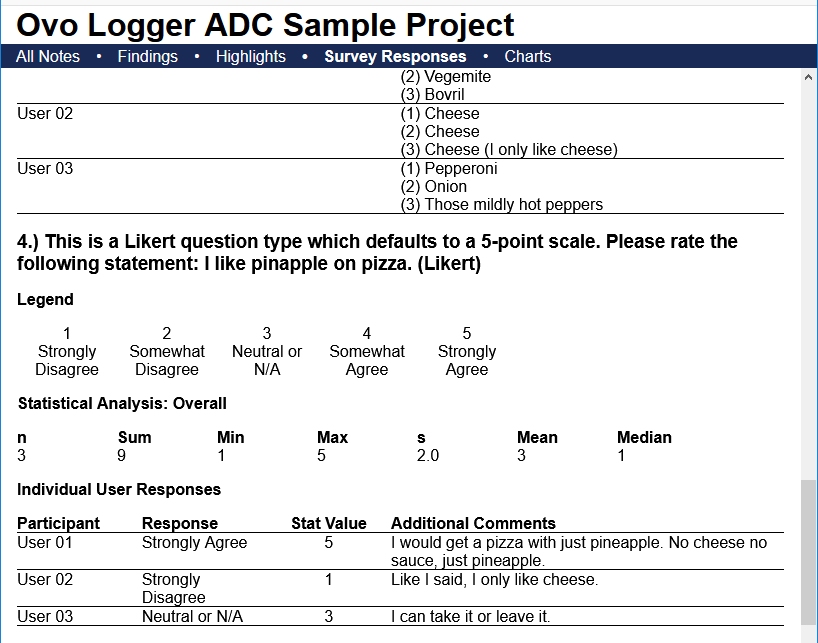
Survey responses: If you deploy surveys with your usability test, they are summarized and presented here.
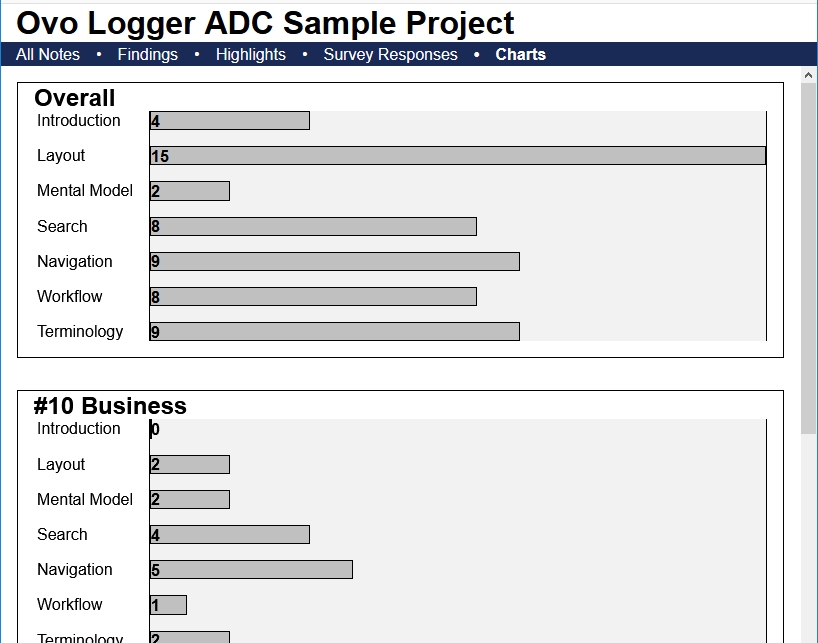
Charts: If you log using QuickLogs, overall marker frequency is calculated as well as for each task sceanario.
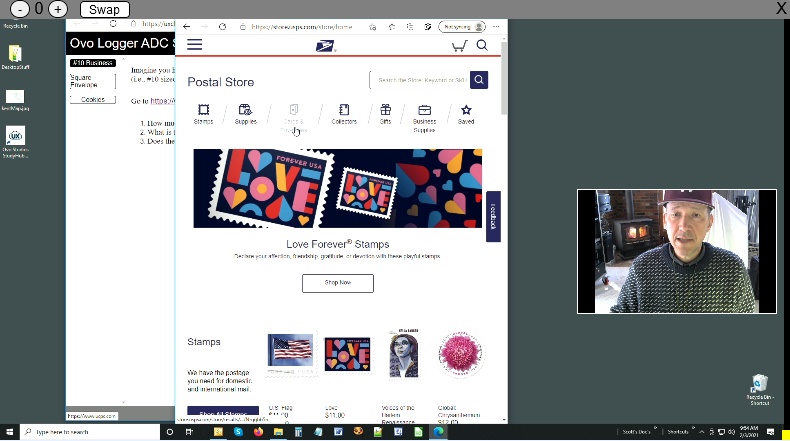
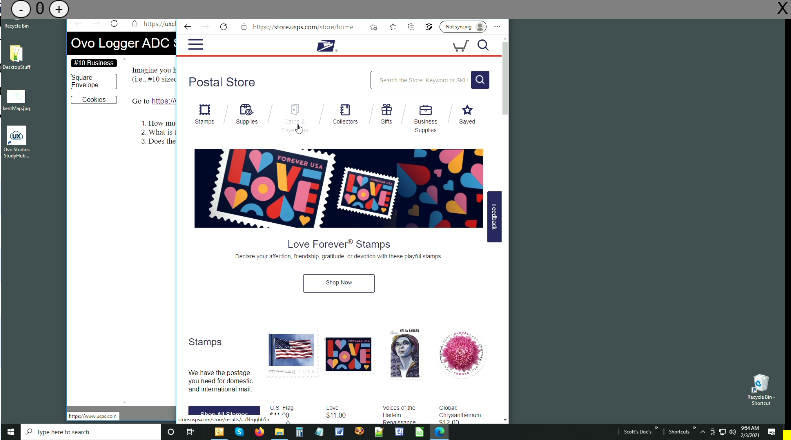
Flexible Recordings Indexed to Observation Time: When you click an observation, video plays at the point in time that the observation was made. Video is in MP4 format and the video player is written in HTML and JavaScript so it is operating system and browser agnostic.
In Ovo Logger's usability report, video can be played two ways:
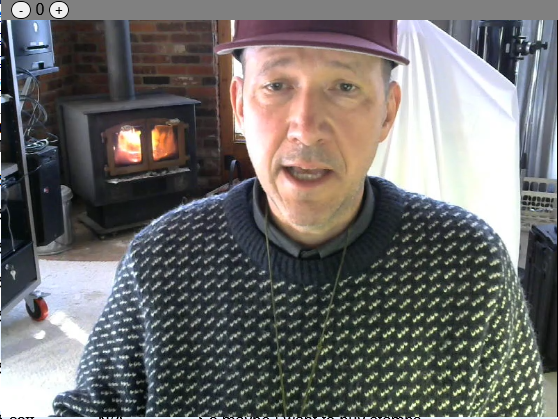
- In a dynamic picture-in-picture where all recorded videos are played.
- Any video source may be played by itself.
Keeping video sources separate gives you post-test flexibility in how they are stored and distributed, e.g., participant face video could be destroyed while PC-only video could be retained.
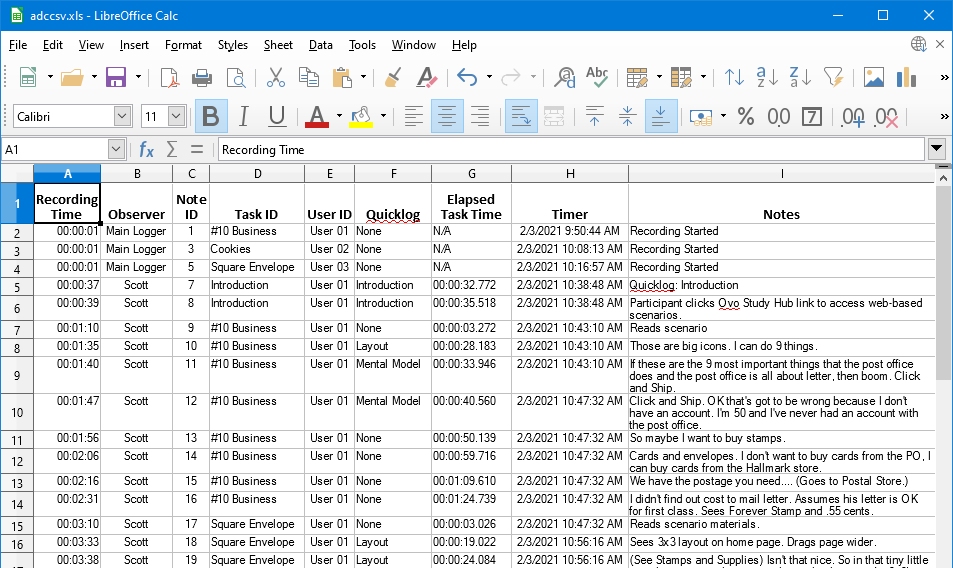
Export to Spreadsheets: Usability test data may also be exported in .CSV format. You may download the XLS for this project here.
Want to Click on a Real Report? A fully active version of the report shown in the above screenshots is available here.