This page focuses on the usability test reporting output of Ovo Studios CaptureUX software. For details about CaptureUX, please go to the CaptureUX page.
Usability Reporting in CaptureUX: Synopsis
Usability test reporting exposes your study's data to your stakeholders and CaptureUX has the following kinds of data:
- Recording up to two USB video inputs as a single MP4 file.
- Textual data logging made via free-form text entry and picking from custom lists of "markers."
- Video highlights.
- Post-test logging functionality is identical to real-time logging.
After your study, logged data and video can be exported to HTML and CSV format within seconds, allowing you to give your stakeholders access to your test data with minimal effort.
The remainder of this page reviews the main data views of the CaptureUX usability report. Click here to jump to the online version of this report.
Usability Reporting in CaptureUX: Screen Shots
CaptureUX's report is in HTML format and uses only client-side code, so it can be viewed from anywhere, i.e., you do not need to host it on a webserver. You could run it from a USB memory stick.
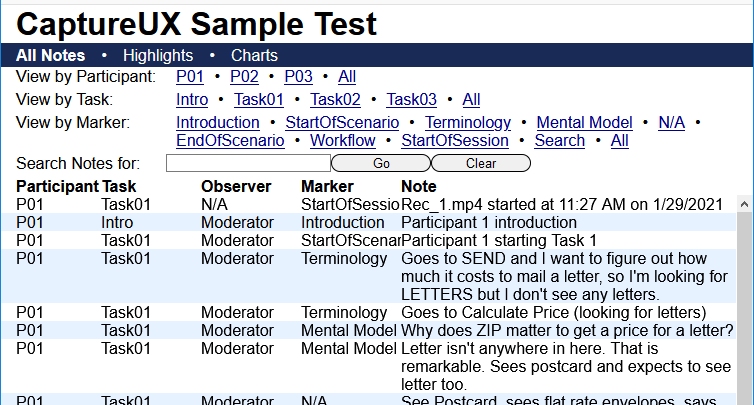
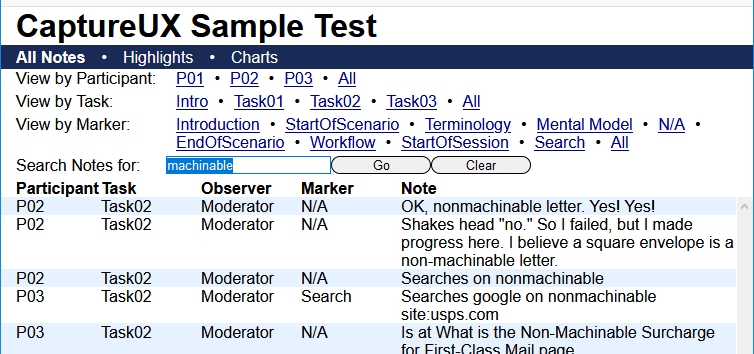
The following screen shot shows the top portion of the CaptureUX report home page. There are four filters you can use to search for observations of interest (participant ID, task ID, marker, and string.)
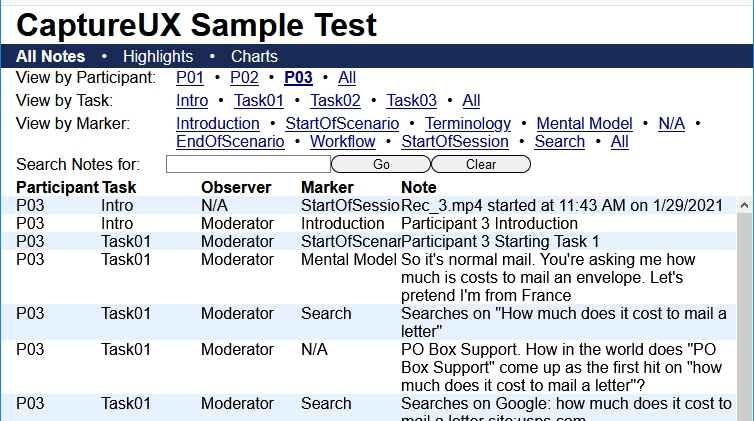
Observations May Be Filtered by Participant ID: If you click a participant ID in the View by Participant filter, logged observations filter to only show observations for that participant ID. P03 has been clicked in the following screen shot.
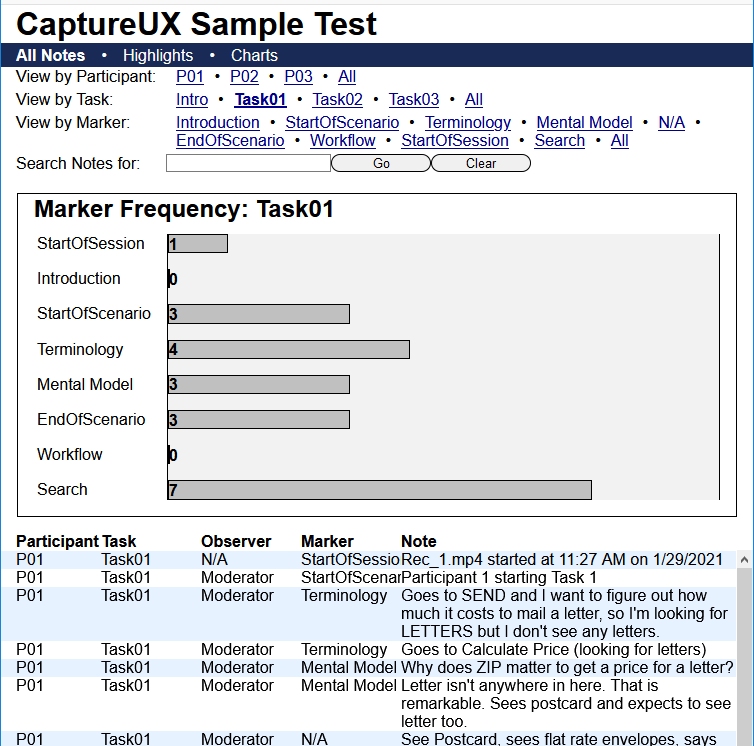
Observations May Be Filtered by Task ID: If you click a task ID in the View by Task filter, logged observations filter to only show observations for that task ID.
When data are filtered for a specific task, marker frequencies are displayed for that task. Task01 has been clicked in the following screen shot. We can see that the "Search" marker was used more than any other marker for Task01.
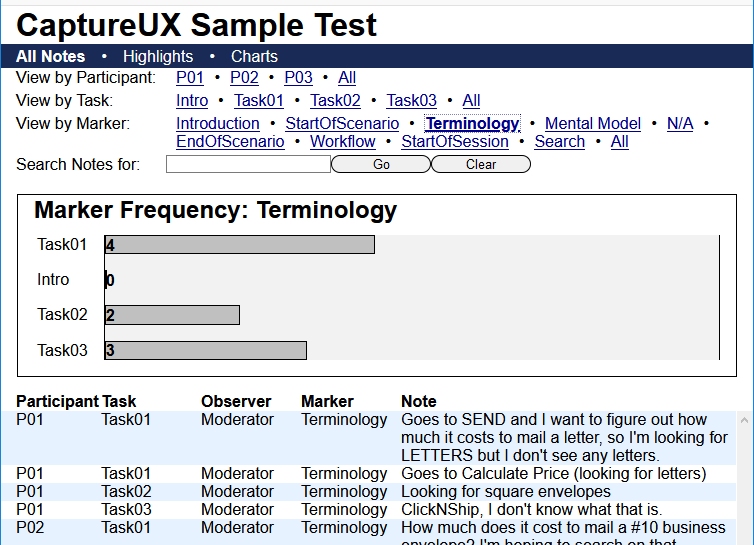
Observations May Be Filtered by Marker If you click a marker in the View by Marker filter, logged observations filter to only show observations that are tagged with that marker. This pulls observations from all participants and tasks that use the selected marker.
When data are filtered for a specific marker, the frequency of that marker in each task is displayed in a bar graph. The marker Terminology is selected in the following screen shot. We can see that Task01 had the most "terminology" related observations.
Observations May Be Filtered by Search String: The last filter in the usability report is string search which displays observations that contain the search string anywhere in the observation note text. Search is not case sensitive.
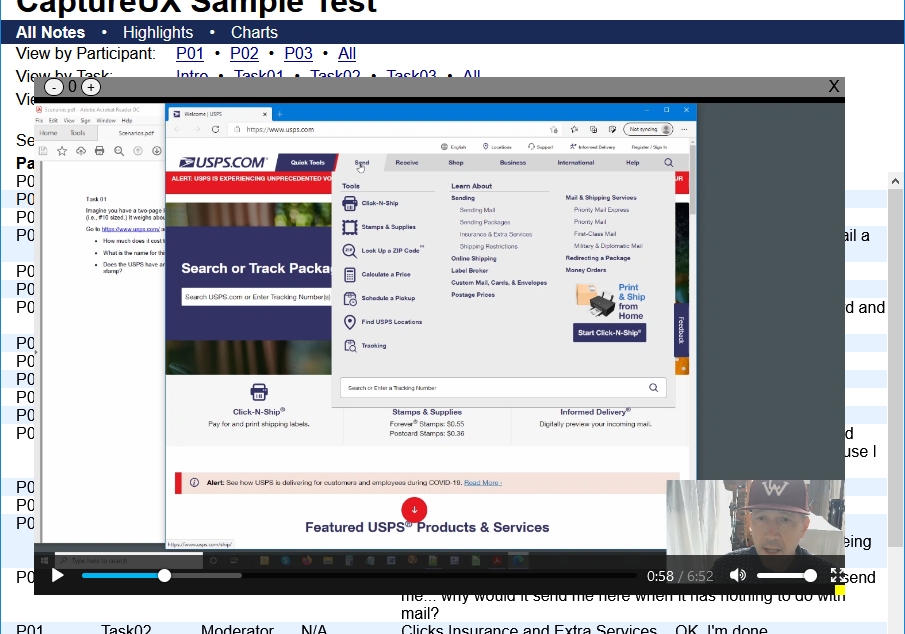
Video is Indexed to Observation Time: When you click an observation, video plays at the point in time that the observation was made. Video is in MP4 format and the video player is written in HTML and JavaScript so it is operating system and browser agnostic.
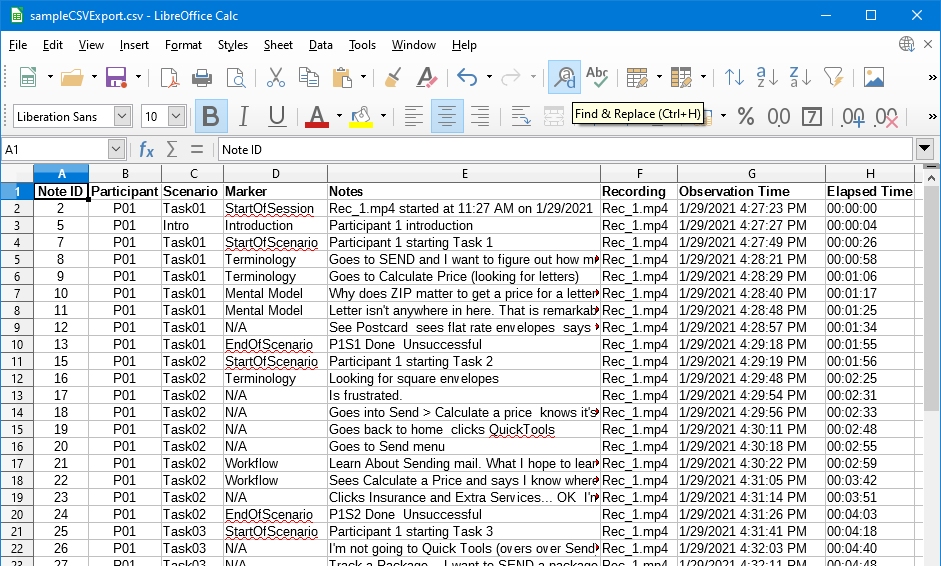
Export to Spreadsheets: Usability test data may also be exported in .CSV format. You may download the CSV for this project here.
Want to Click on a Real Report? A fully active version of the report shown in the above screenshots is available here.