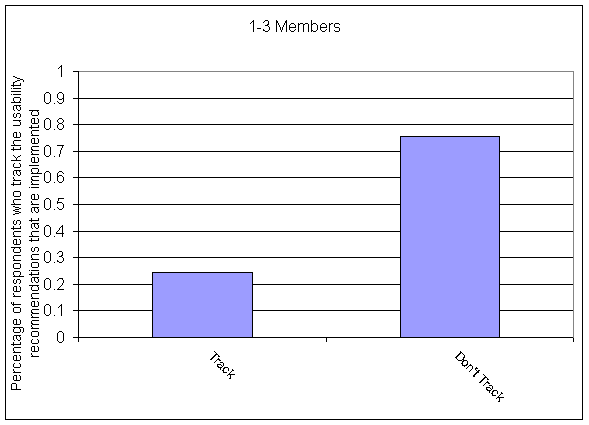

This graph indicates the percentage of the 45 of 100 survey respondents with a team consisting of 1-3 members in an organization and if they track the usability recommendations that are actually implemented.
If you follow up with developers, please tell us more about your interactions:
I track the percentage of usability recommendations that are actually implemented.